Popular Education Workshops
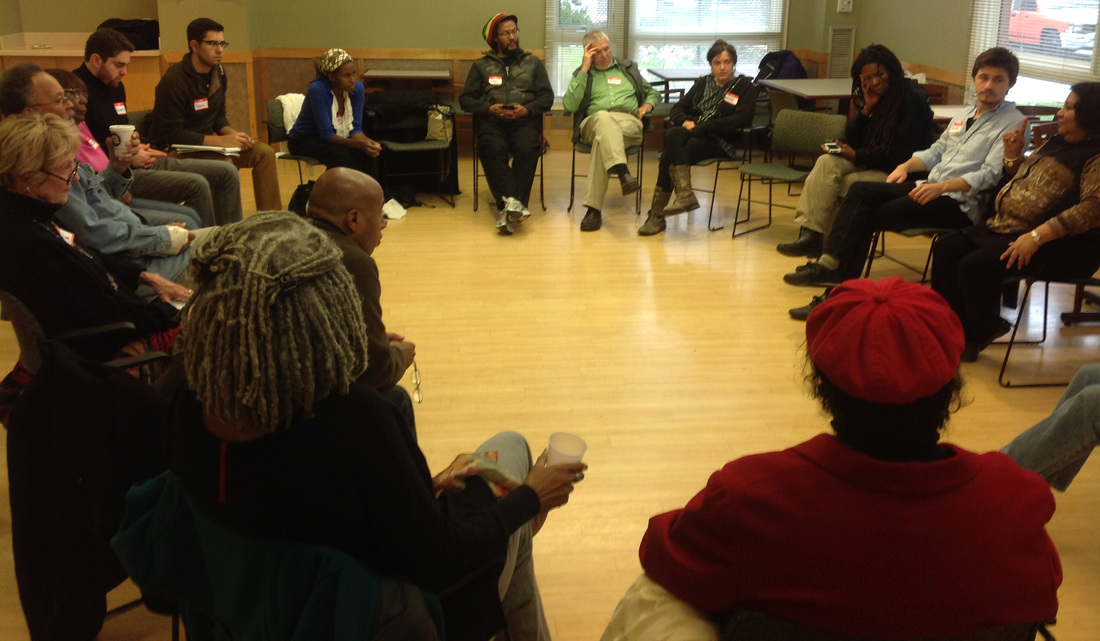
Members gathered on November 1st at the Julia Martin House for the first of a two-part popular education workshop: Connecting the Dots: Root Causes of Inequality.
On an icy Saturday morning community members joined NIAAS and United for a Fair Economy for the first part of a conversation on the root causes of inequality. Community members at the workshop represented groups such as the New Start Project, Project Hip Hop, Boston College Center for Human Rights & International Justice, bringing residents together from the greater Boston area.
The workshop used Popular Economics Education, allowing everyone to draw from their experience to create a conversation around economic justice based in their daily lives. These popular education activities included:
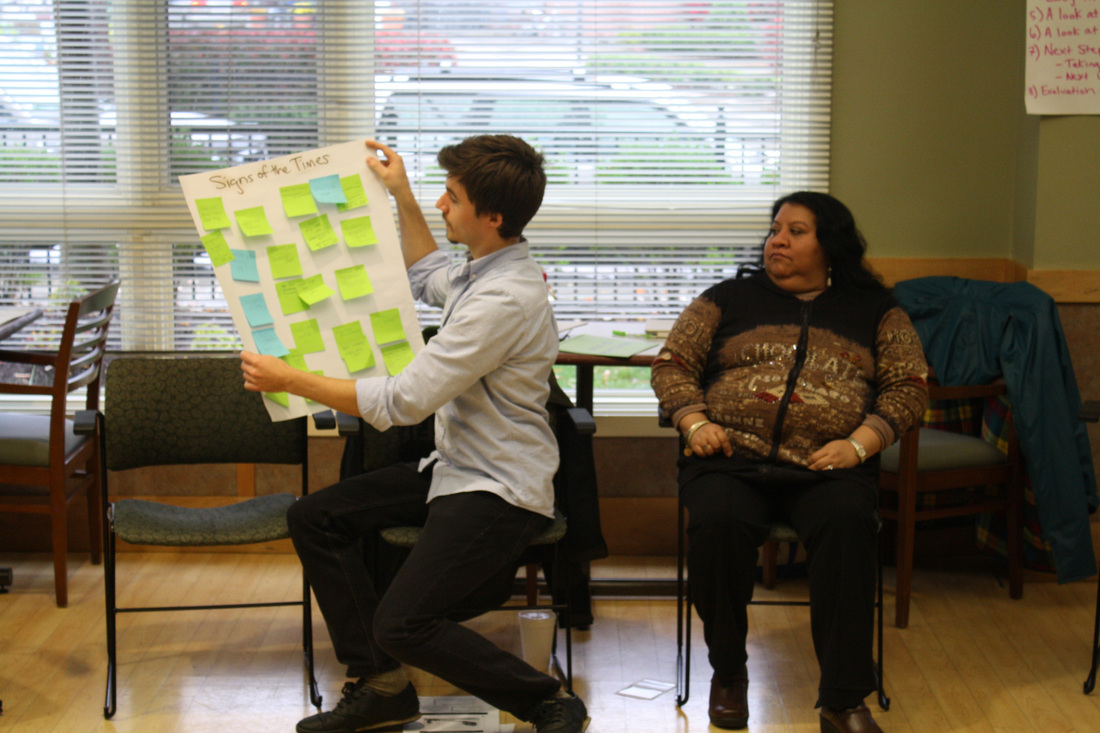
Sign of the Times
We paired up in groups and our task was to write general themes about our experiences of the economy on sticky notes. After discussing in pairs, we shared our thoughts with the group. Themes shared ranged from increasing rests and falling wage, to the cost of war, to the wealth gap and individuals born into debt.
On an icy Saturday morning community members joined NIAAS and United for a Fair Economy for the first part of a conversation on the root causes of inequality. Community members at the workshop represented groups such as the New Start Project, Project Hip Hop, Boston College Center for Human Rights & International Justice, bringing residents together from the greater Boston area.
The workshop used Popular Economics Education, allowing everyone to draw from their experience to create a conversation around economic justice based in their daily lives. These popular education activities included:
Sign of the Times
We paired up in groups and our task was to write general themes about our experiences of the economy on sticky notes. After discussing in pairs, we shared our thoughts with the group. Themes shared ranged from increasing rests and falling wage, to the cost of war, to the wealth gap and individuals born into debt.
Ten Chairs
Ten brave members volunteered to sit in a ten chairs lined up against the wall. Each person was told that they represent 10% of the population and that each chair represented 10% of wealth. A world with equal wealth distribution would resemble the one person in each chair.
Ten brave members volunteered to sit in a ten chairs lined up against the wall. Each person was told that they represent 10% of the population and that each chair represented 10% of wealth. A world with equal wealth distribution would resemble the one person in each chair.
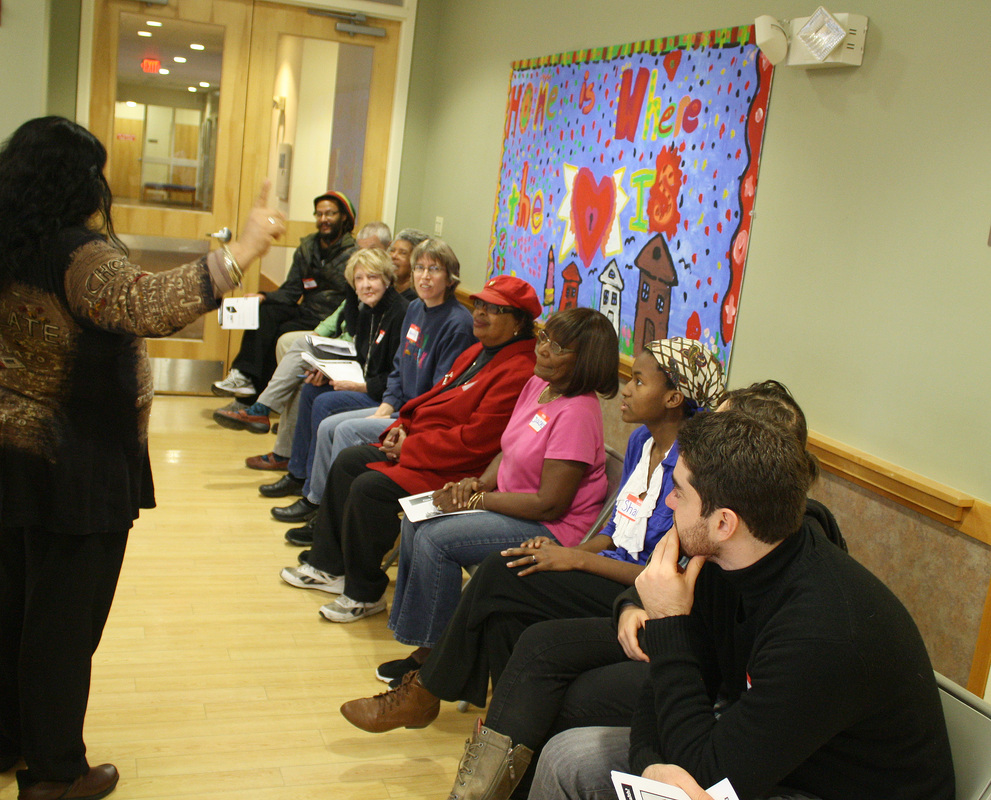
As the volunteers were getting comfortable in their seats, and with their wealth, Jeanette, revealed that in 2010, the top 10% of the population owned 71% of the wealth, and that the 6 people next to the end were evicted from their seat so Mr. top 10% can enjoy his 7 chairs. As Mr. Top 10% became comfortable with his expanded wealth, the 6 displaced people had to join the 3 people at the end and join them on their chairs. All 9 people needed to share 3 seats, a task that proved to be difficult. While 9 people were busy figuring out how to sit on just 3 chairs, Jeanette shared that within the top 10% there is difference, and that in 2007 the top 1% (let’s say Mr. 10% arm) owned about 35% of the wealth, or 3 and a half chairs – the equivalent of what the 9 people at the other end were struggling over!
Walking Quintile Activity
1979-2009
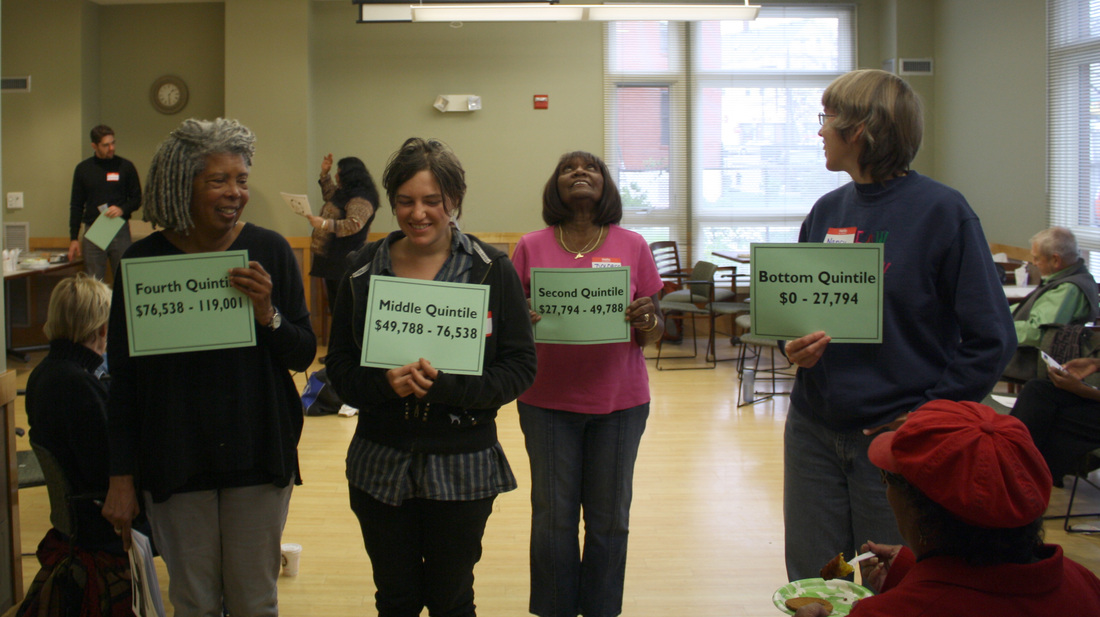
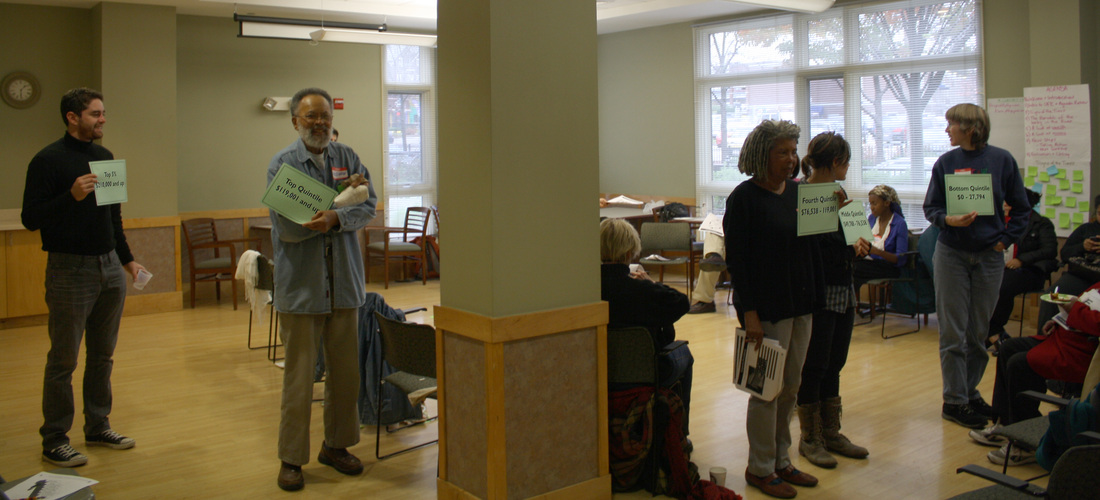
Another 5 brave volunteers walked up to the front of the room, where Riahl gave them cards labeling them as one of the 5 quintiles and their corresponding incomes. The Riahl told each quantile that we are going to examine the percent change income change from 1979 to 2009, and that for each 5% change the quantile will take one step. A step forward is a positive 5% change, and a step backwards is a negative 5% change. Beginning with the bottom quintile ($0-27,794), we discussed who would be part of that category, members suggested retail workers, part time workers, and the unemployed among others. As the top quintile heard his change, he grinned as he walked ten steps forward, more than 5 steps past anyone else.
1979-2009
Another 5 brave volunteers walked up to the front of the room, where Riahl gave them cards labeling them as one of the 5 quintiles and their corresponding incomes. The Riahl told each quantile that we are going to examine the percent change income change from 1979 to 2009, and that for each 5% change the quantile will take one step. A step forward is a positive 5% change, and a step backwards is a negative 5% change. Beginning with the bottom quintile ($0-27,794), we discussed who would be part of that category, members suggested retail workers, part time workers, and the unemployed among others. As the top quintile heard his change, he grinned as he walked ten steps forward, more than 5 steps past anyone else.
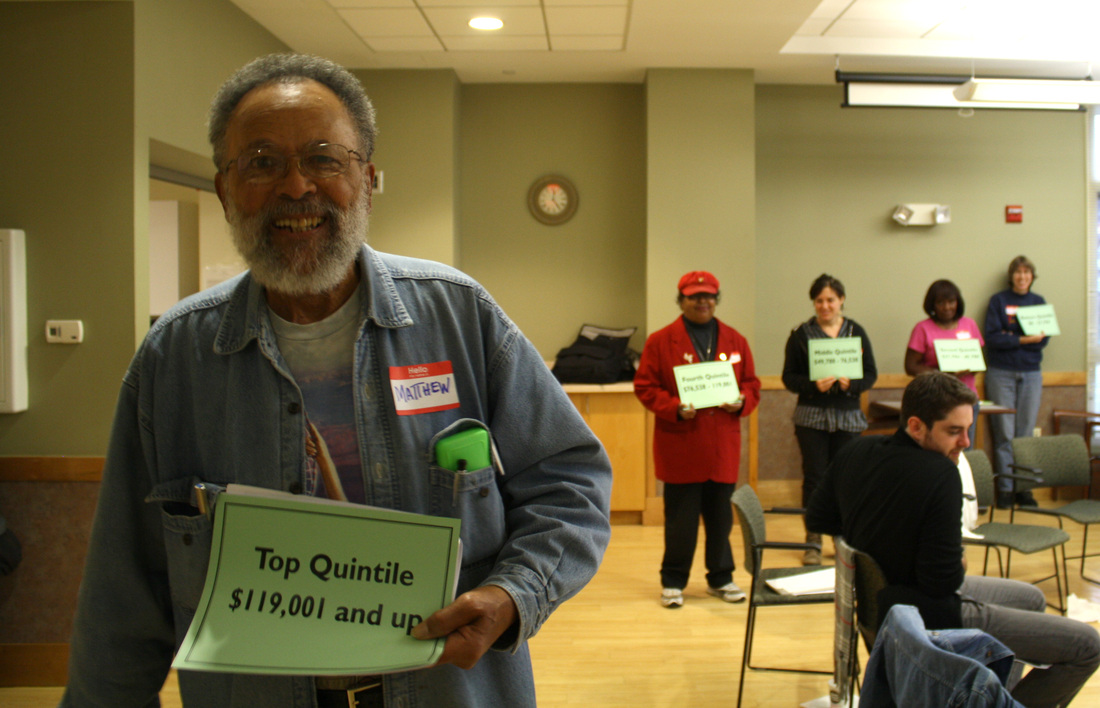
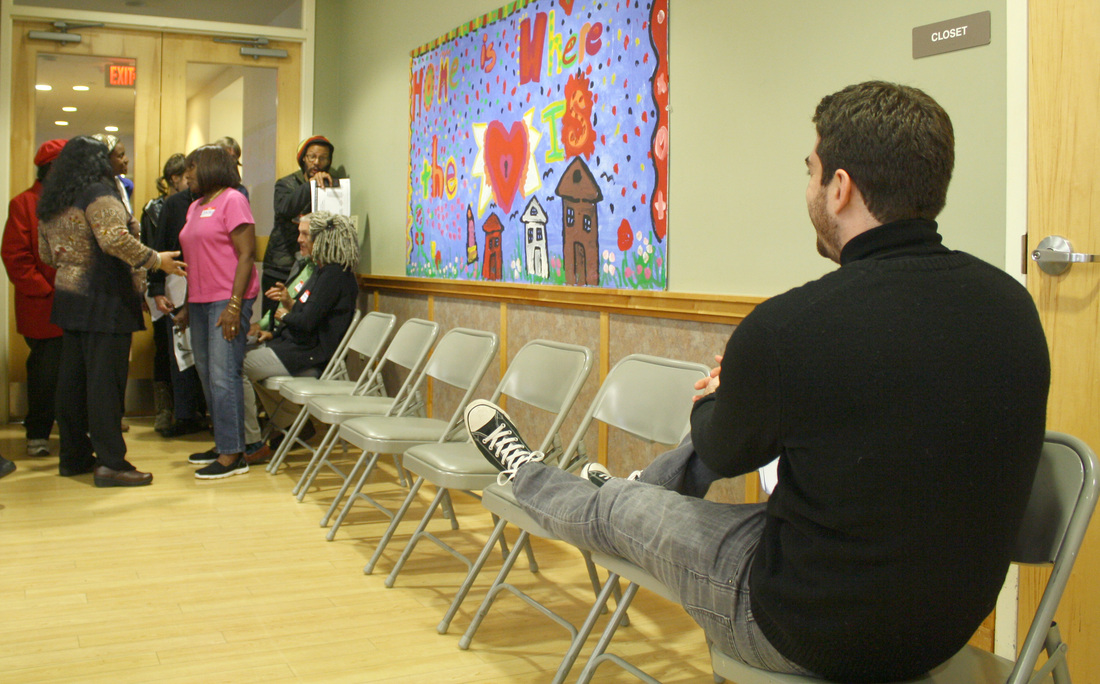
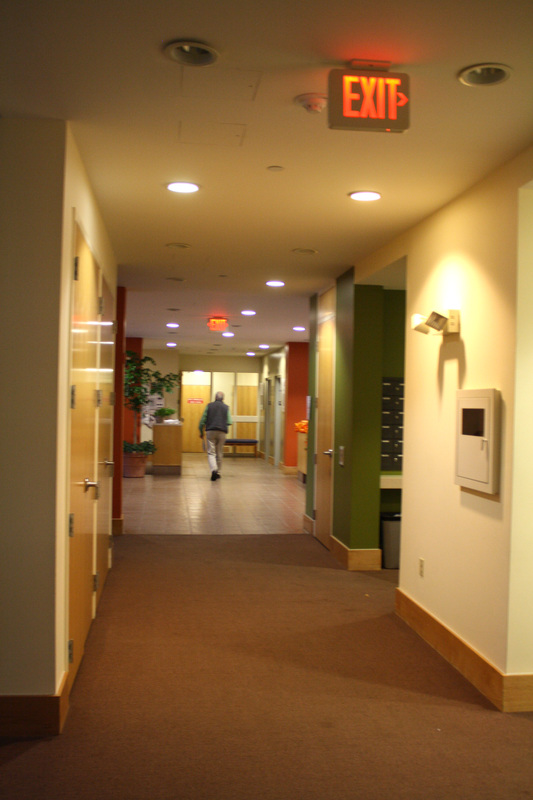
Yet, Riahl had some more information to share – he wanted to break quintile to just examine the top 5%. Mr. Top 5% took 15 and half steps forward, zooming past the top quintile. Riahl was not done, he asked for a volunteer to represent the top 1%. The room wasn’t big enough for Mr. Top 1%, he had to take 34 steps, right out the door into the hall, leaving Mr. Top 5% and the other quintiles staring at his back as he walked merrily along.
1949-1979
We returned the Walking Quintile activity, but this time we were going to examine the period from 1949-1979. For this round each step in this version represents a 10% gain or loss. The five brave volunteers returned to their places at the front of the room. Riahl began asking each quintile to take a step: the bottom quintile 12 steps forward, the second 10 steps, the middle 11 steps, the fourth 11.5 steps, the highest 10 steps.
We returned the Walking Quintile activity, but this time we were going to examine the period from 1949-1979. For this round each step in this version represents a 10% gain or loss. The five brave volunteers returned to their places at the front of the room. Riahl began asking each quintile to take a step: the bottom quintile 12 steps forward, the second 10 steps, the middle 11 steps, the fourth 11.5 steps, the highest 10 steps.
Riahl invited Mr. Top 5% back up, and everyone held their breath wondering what would happen to what looked like relatively equal growth among quintiles. Riahl asked Mr. Top 5% to take 8 steps forward.
One of the first responses as we came back to the circle was, “What happened to us?” Jeanette enthusiastically remarked that if it happened once, it can happen again!
Want to hear more of the conversation? Read the memoria here!
Want to hear more of the conversation? Read the memoria here!
